Population snapshots predict early haematopoietic and erythroid hierarchies
Betsabeh Khoramian Tusi*, Samuel L. Wolock*, Caleb Weinreb*, Yung Hwang, Daniel Hidalgo, Rapolas Zilionis, Ari Waisman, Jun Huh, Allon M. Klein, Merav Socolovsky
Abstract
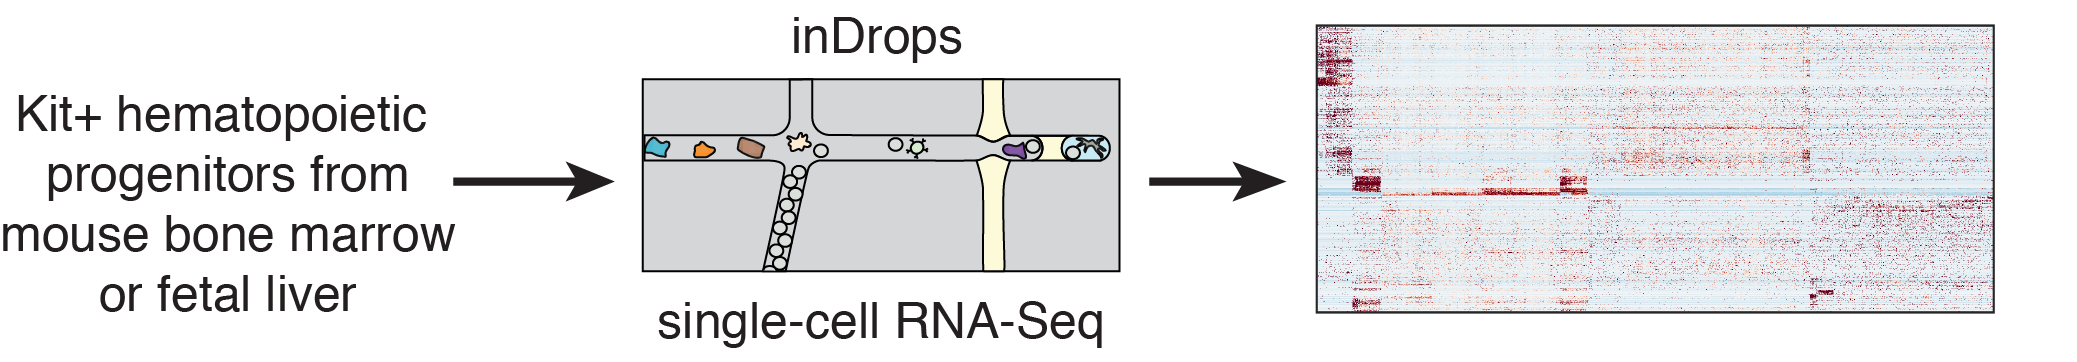
The formation of red blood cells begins with the differentiation of multipotent haematopoietic progenitors. Reconstructing the steps of this differentiation represents a general challenge in stem-cell biology. Here we used single-cell transcriptomics, fate assays and a theory that allows the prediction of cell fates from population snapshots, to demonstrate that mouse hematopoietic progenitors differentiate through a continuous, hierarchical structure into seven blood lineages. We uncovered coupling between the erythroid and the basophil or mast cell fates, a global haematopoietic response to erythroid stress and novel growth factor receptors that regulate erythropoiesis. We defined a flow cytometry sorting strategy to purify early stages of erythroid differentiation, completely isolating classically defined burst-forming and colony-forming progenitors. We also found that the cell cycle is progressively remodelled during erythroid development and during a sharp transcriptional switch that ends the colony-forming progenitor stage and activates terminal differentiation. Our work showcases the utility of linking transcriptomic data to predictive fate models, and provides insights into lineage development in vivo.
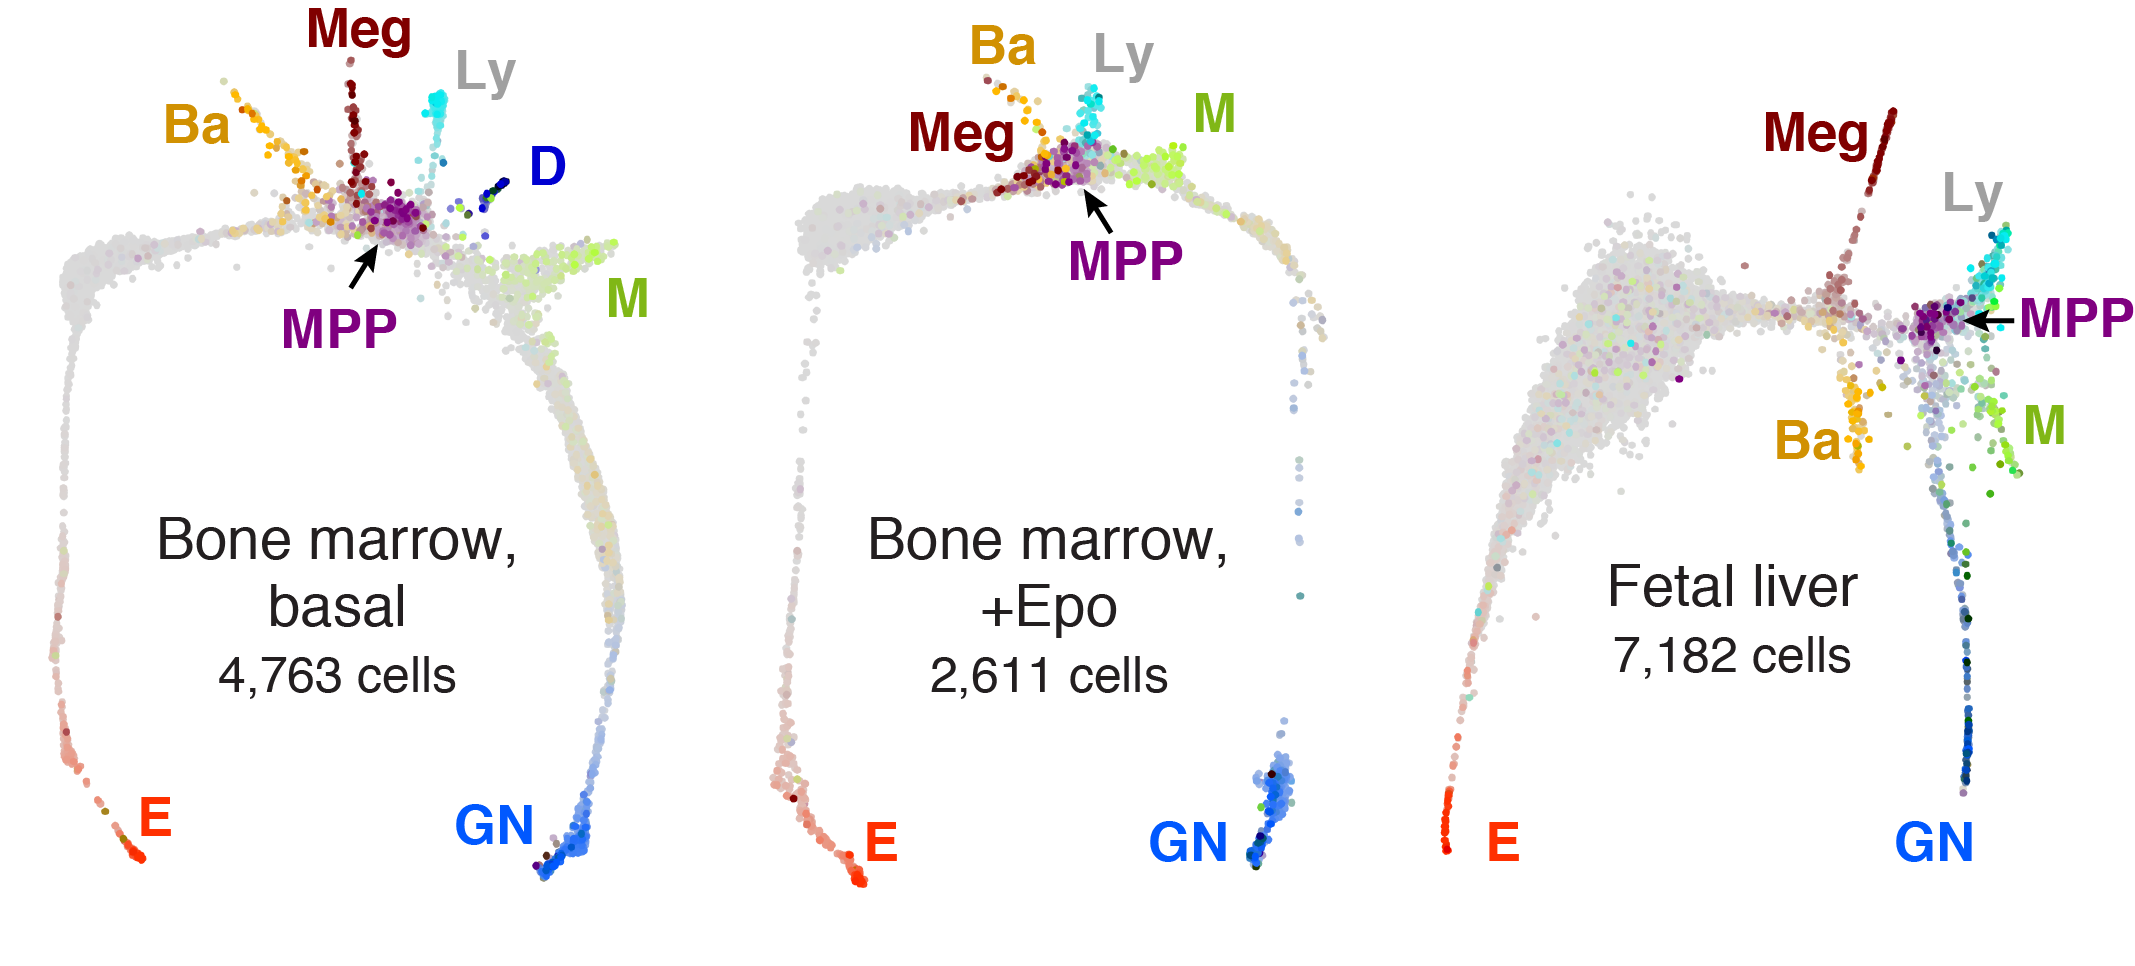
E = Erythroid, Ba = Basophil/Mast cell, Meg = Megakaryocyte, Ly = Lymphoid, D = Dendritic cell
M = Monocyte, GN = Granulocytic neutrophil, MPP = Multipotent progenitor
Explore the data using SPRING
SPRING is a tool for uncovering high-dimensional structure in single-cell gene expression data. We have pre-loaded each data set to allow easy exploration, including visualization of gene expression patterns and identification of marker genes.
Click a data set below to view:
Kit+ Bone marrow, basal
Kit+ Bone marrow, +Epo
Kit+ Fetal liver
FACS subsets P1-P5 (from basal bone marrow)
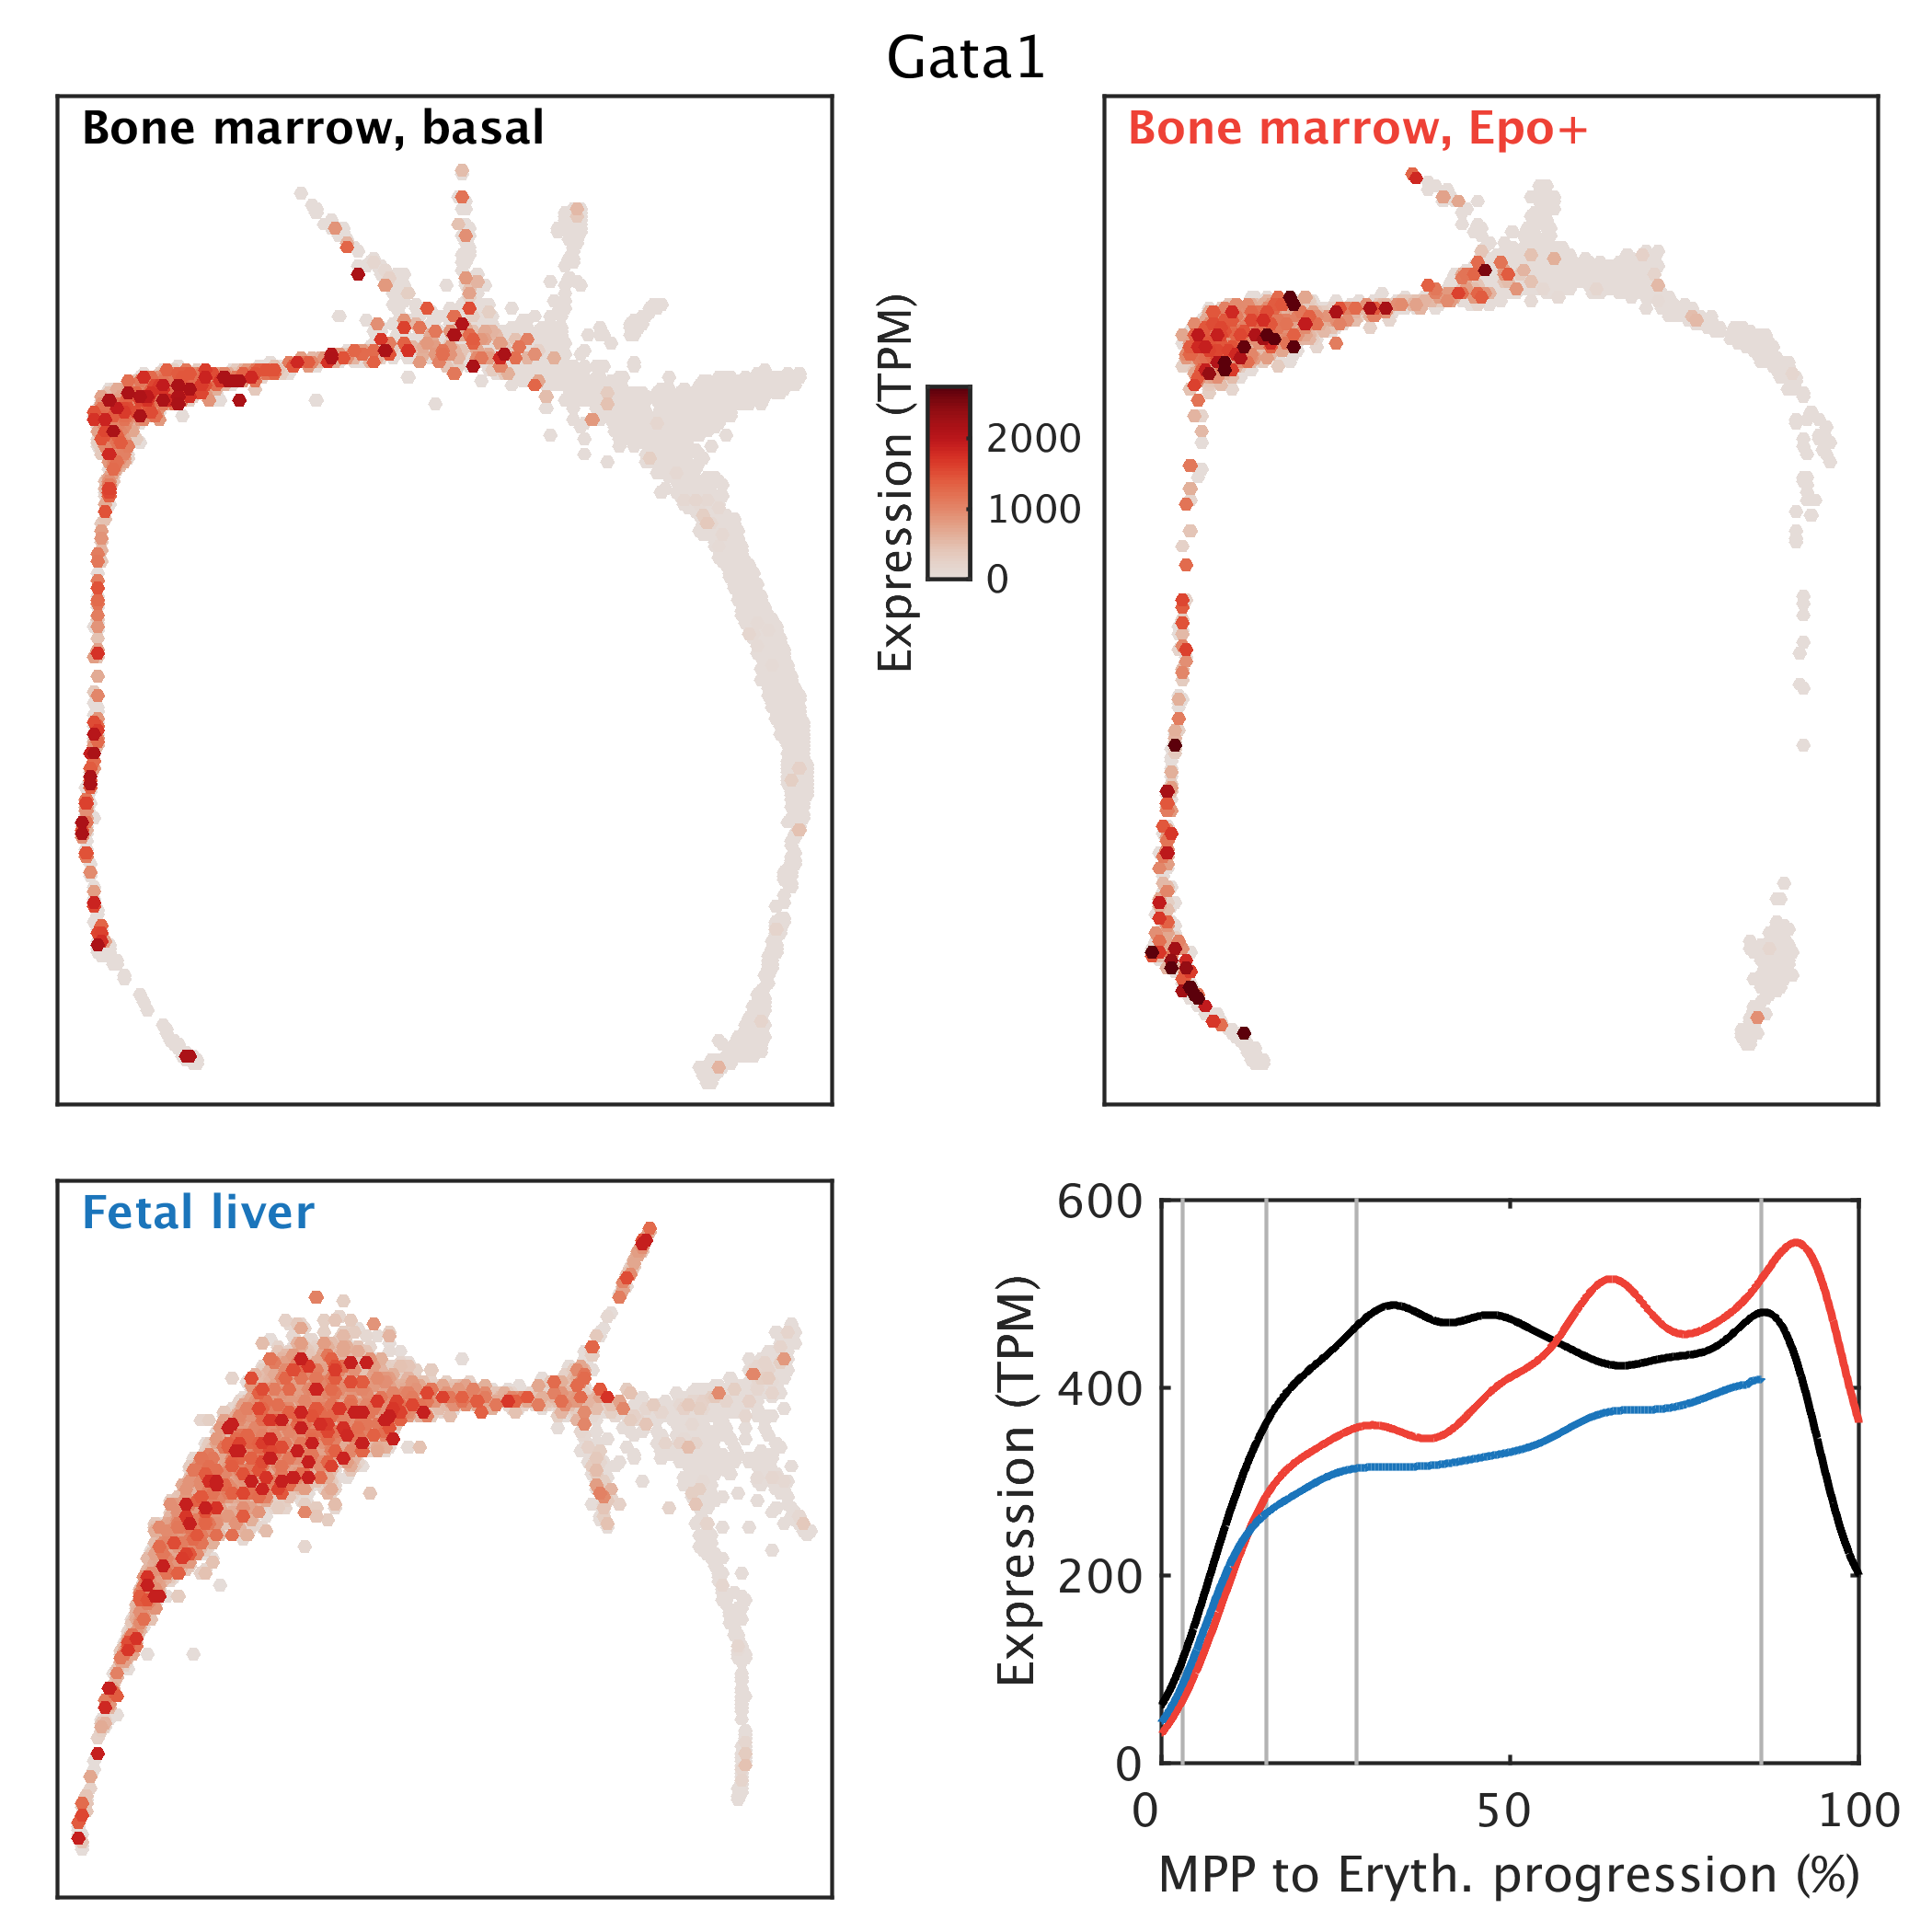
Or enter a gene name to view its expression pattern in all three samples
We display the gene's expression overlaid on each sample's SPRING plot, along with smoothed gene expression traces over the MPP-to-erythroid differentiation axis (0% corresponds to unbiased MPPs, 100% to cells undergoing erythroid terminal differentiation).
Click here to go to the latest version of this website.
Bone marrow, basal
Bone marrow, Epo+
Fetal liver
Bugs, questions, or comments? Please send an email to swolock@g.harvard.edu.