Single-cell mapping of gene expression landscapes and lineage in the zebrafish embryo
Daniel E. Wagner, Caleb Weinreb, Zach M. Collins, James A. Briggs, Sean G. Megason, Allon M. Klein
Abstract
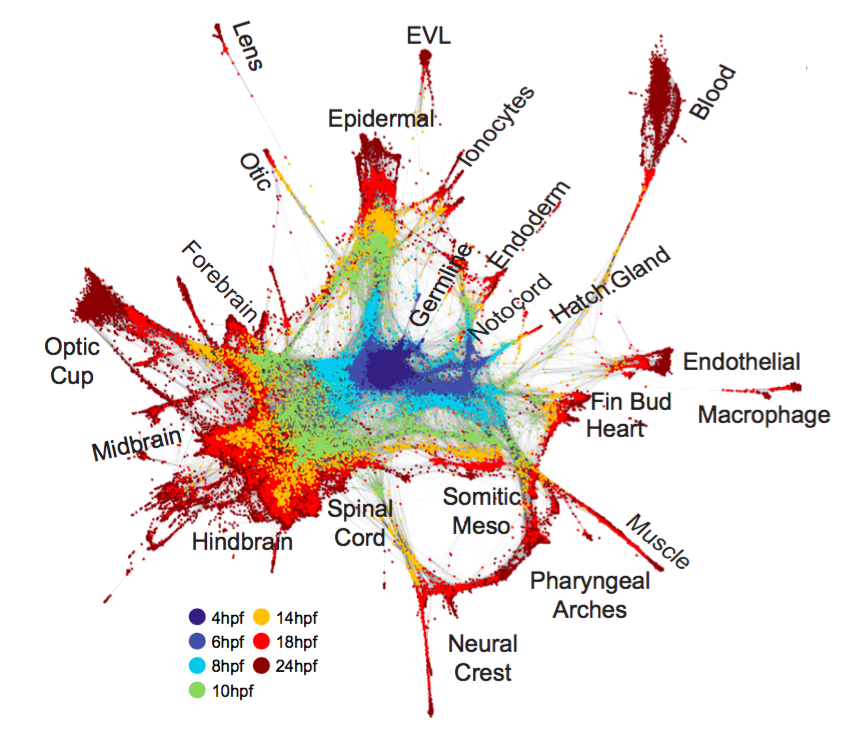
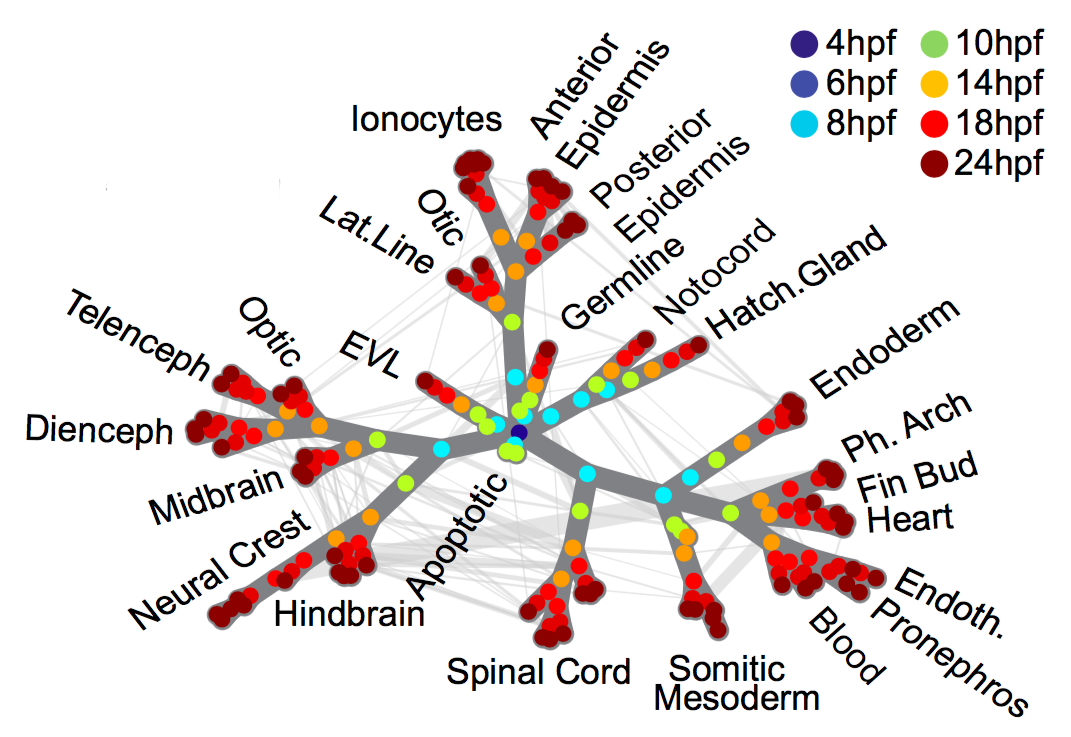
High-throughput mapping of cellular differentiation hierarchies from single-cell data promises to empower systematic interrogations of vertebrate development and disease. Here, we applied single-cell RNA sequencing to >92,000 cells from zebrafish embryos during the first day of development. Using a graph-based approach, we mapped a cell state landscape that describes axis patterning, germ layer formation, and organogenesis. We tested how clonally related cells traverse this landscape by developing a transposon-based barcoding approach (“TracerSeq”) for reconstructing single-cell lineage histories. Clonally related cells were often restricted by the state landscape, including a case in which two independent lineages converge on similar fates. Cell fates remained restricted to this landscape in chordin-deficient embryos. We provide web-based resources for further analysis of the single-cell data.
Science 26 Apr 2018. doi:10.1126/science.aar4362
Get the data
The full dataset is deposited in NCBI GEO under accession number GSE112294.
Matlab code for generating the single-cell graph is available on GitHub.
A Matlab version of the dataset can be downloaded here.
A ScanPy version of the dataset can be downloaded here.
Explore the data using SPRING
SPRING is a tool for interactive exploration of single-cell data. We provide two SPRING-based interfaces for the Zebrafish time course data. The "single-cell graph" shows all individual cells across all time points and the "coarse-grained graph" shows cell clusters and their connectivity.
Bugs, questions, or comments? Please send an email to calebsw@gmail.com.

